Visualising Student Activity Logs using Tableau

[favorite_button]

Creator(s)

Organisation(s)

Technological University Dublin

Discipline(s)

Teaching & Learning

Topic(s)

Learning Analytics

License

CC BY-NC-SA

Media Format

Webpage

Date Submitted

Submitted by

Export Resource Data

Description

This resource was developed from the SATLE 2018 initiative: Developing All Learners Through Analytics Initiative (DALTAÍ)
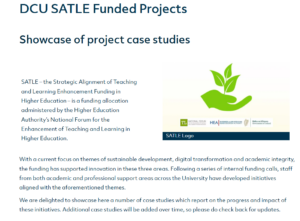
Benefit of this resource and how to make the best use of it

This chapter is a step by step guide to creating visualisations in Tableau that can provide insights into student behaviour on a tech tool. The chapter focuses on visualising data from an activity log. Many tech tools generate a log of every activity taken by users of the tool. This log typically records the date and time of the activity; who did it; and what the activity was (e.g. view a post; submit an assessment etc.). 

Creative Commons Attribution-NonCommercial-ShareAlike (CC BY-NC-SA)

This work is licensed under a CC BY-NC-SA license, allowing sharing and adaptation for non-commercial use with proper attribution, provided derivative works use the same license.

https://creativecommons.org/licenses/by-nc-sa/4.0/
? This citation is automatically generated and may require adjustment. Always verify it against your style guide.
Technological University Dublin (2021). Visualising student activity logs using tableau. National Resource Hub (Ireland). Retrieved from: https://hub.teachingandlearning.ie/resource/visualising-student-activity-logs-using-tableau/ License: Creative Commons Attribution-NonCommercial-ShareAlike (CC BY-NC-SA).

Adapting this resource? Share your version!

If you have modified or adopted this resource, share your version here. Tracking adaptations helps us measure impact and connects others with useful updates.

Related OER

The resource is a template for surveying students about their timetabling experiences. The survey was deployed in MTU, but the template is free to be copied and adapted as needed.